❏ Setting Permissions
In order to edit a Gantt chart, you must have the “View gantt chart” and “Manage gantt chart” permissions. These can be selected under “Administration > Roles and Permissions”.
Note:
Be aware that if you do not have permission to view a Gantt chart, it will not be displayed in the project menu even if the Lychee Schedule Management (Gantt Chart) module is set to ON.
❏ Changing Dates (Period)
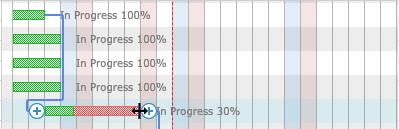
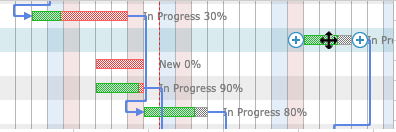
Moving your cursor to the edge of a Gantt bar displayed in a Gantt chart will cause the cursor to change to . Clicking and dragging will then allow you to change the length of the Gantt bar, thereby changing the time period.
❏ Changing Dates (Start Date)
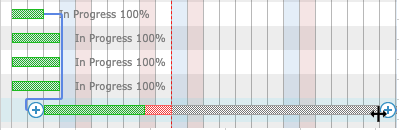
Moving your cursor anywhere over a Gantt bar other than the edges will cause the cursor to change to . Clicking and dragging will then allow you to move the Gantt bar, thereby changing the start date.
❏ Setting Dates
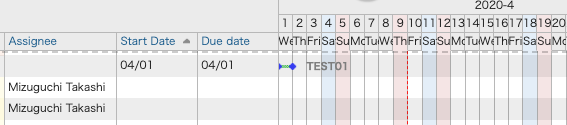
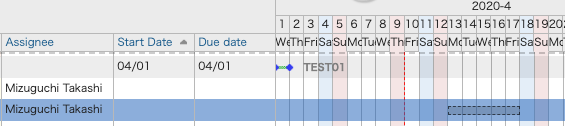
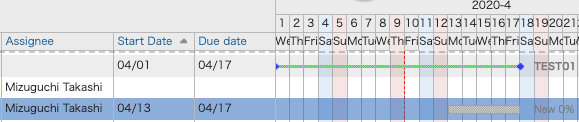
Issues which do not have specified dates can be dragged in the Gantt area to set their start and due dates.
❏ Solid Lines Displayed in Gantt Charts
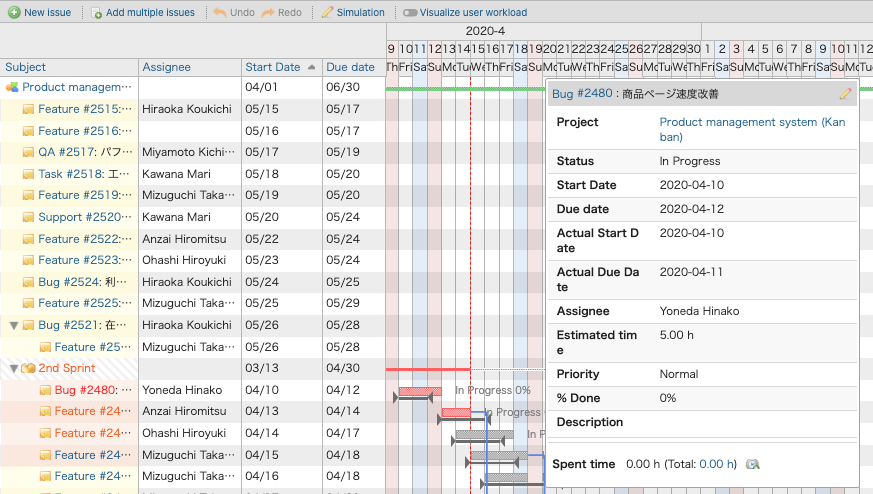
The actual start and due dates recorded for an issue will be displayed in the Gantt chart as a solid line. If the actual due date is not entered, the issue will be displayed as a solid line from the actual start date until the current date.
❏ Creating a New Issue
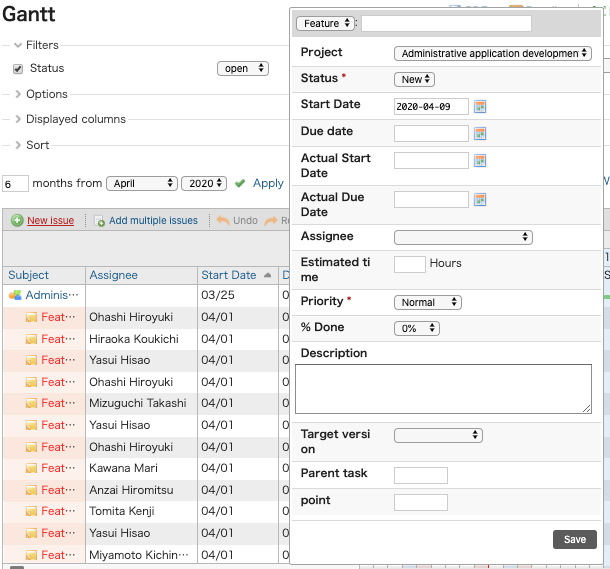
Clicking the New Issue link in the top left of a Gantt chart allows you to register a new issue from the issue editing form.
❏ Editing an Issue
1.Editing from the issue editing form
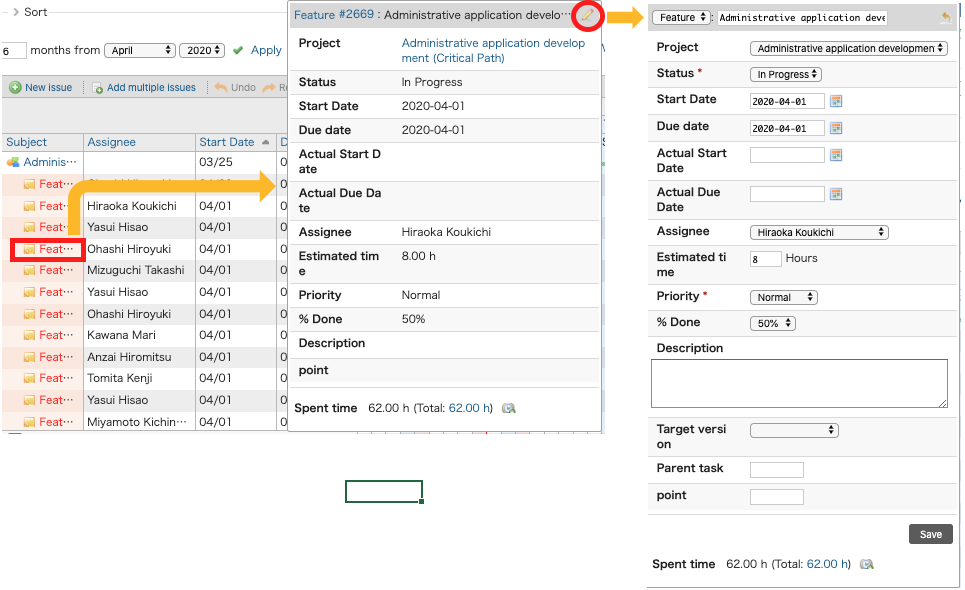
Clicking on either an issue’s number or Gantt bar on the Gantt chart will display the issue editing form.
Clicking the pencil icon in the top right will allow you to edit and update information.
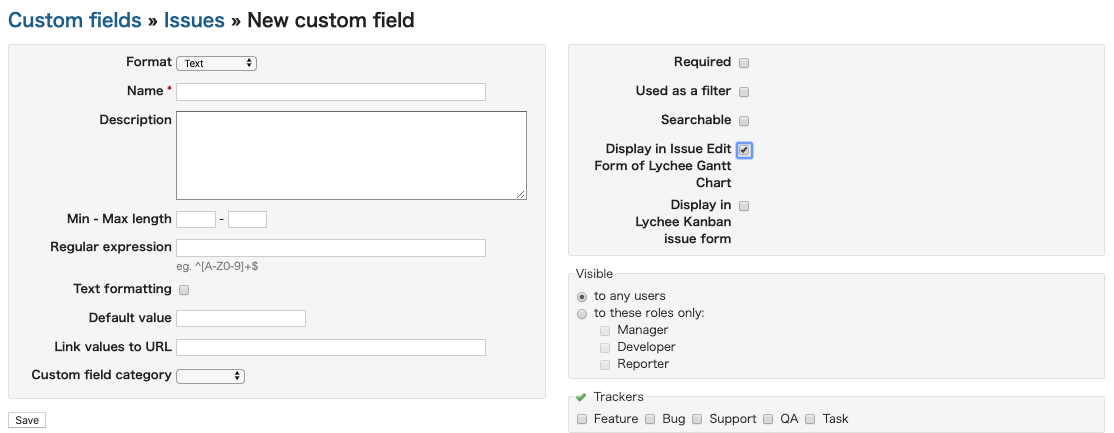
To display custom fields in the issue editing form, go to the Custom Fields settings screen and check the box for “Display in Issue Edit Form of Lychee Gantt Chart”.
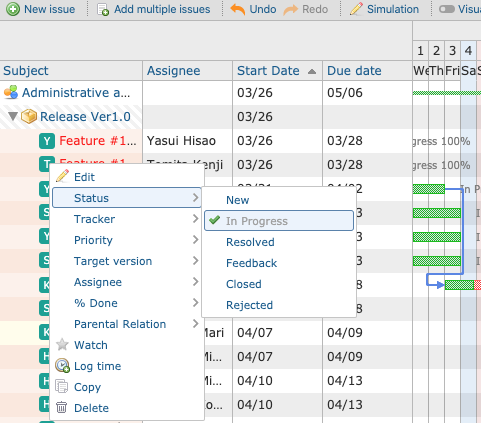
2.Editing from Context Menus
Right-clicking on an issue in the left pane will display a context menu. From here, you can update standard editing items such as status, tracker, and priority. You can also perform operations such as deleting the issue.
❏ Changing Sequence of Issues
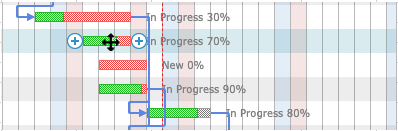
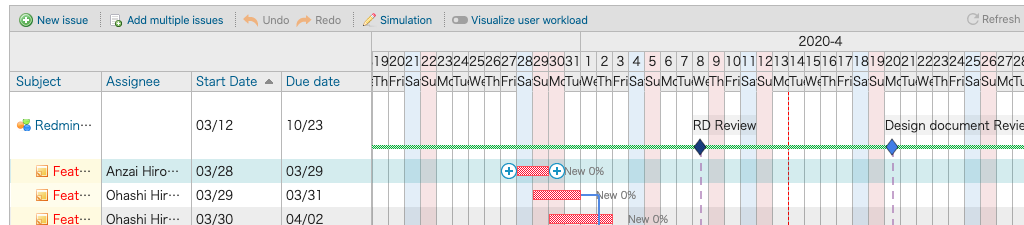
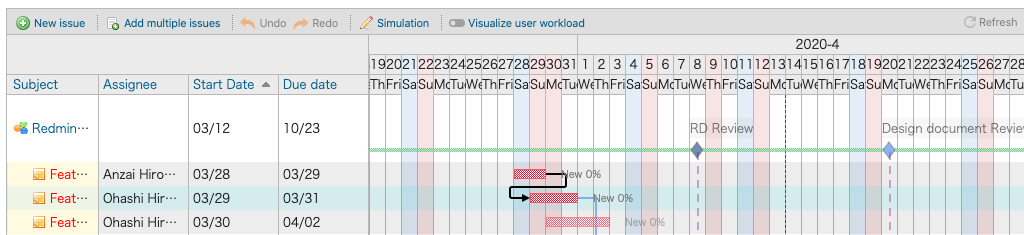
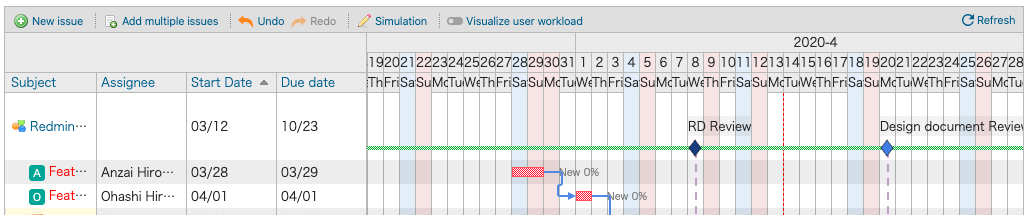
Moving your cursor over a Gantt bar will cause a button to be displayed. Clicking this button will move the cursor to a linked issue and cause a black line to be displayed.
Clicking on the Gantt bar for the linked issue will allow you to change the sequential order of issues.
❏ Changing Parent-Child Relationships between Issues
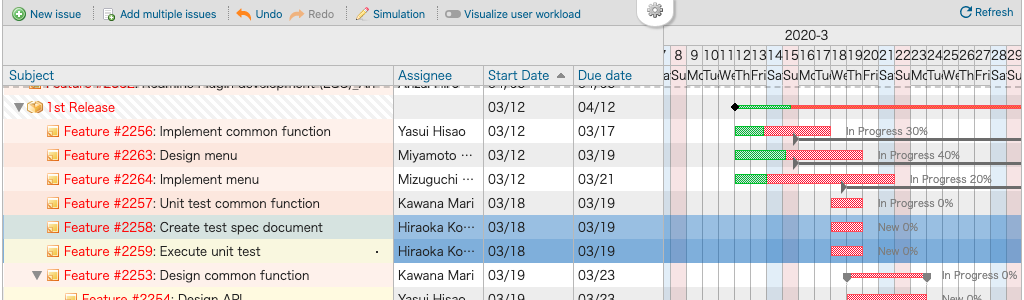
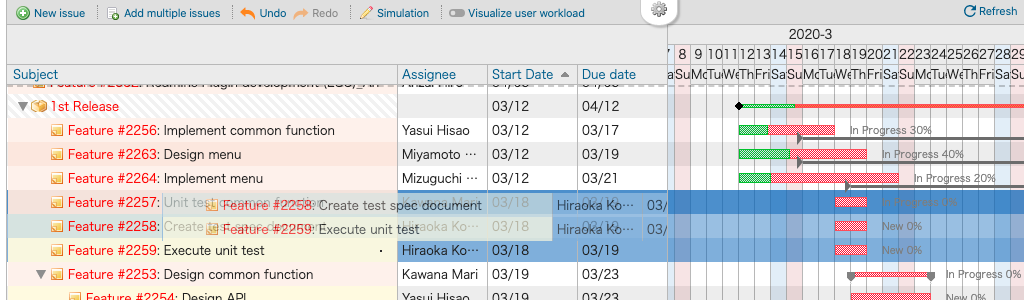
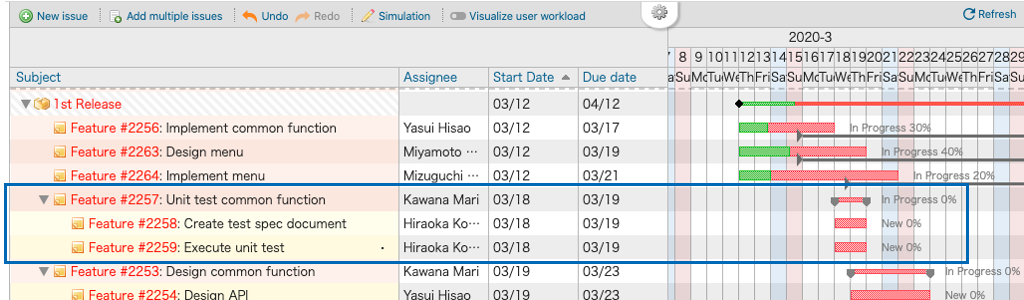
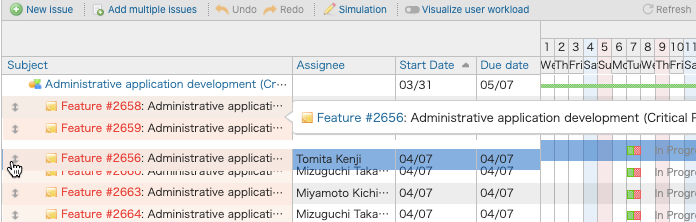
Click the issue you want to be the child issue, turning the row blue. Now drag and drop the child issue onto the intended parent issue. This will create a parent-child relationship between the issues.
*To create several child issues at the same time, control+click each row (command+click for Macs) to select multiple rows.
Additionally, clicking on the intended child issue and then right-clicking on the row of the intended parent issue will call up a context menu. Selecting “Parental Relation > Adopt issues as children” will also allow you to create a parent-child relationship between issues.
❏ Collapsing/Expanding Parent-child Issues
Clicking an issue’s ▼ icon in the left pane will collapse the display of parent-child relationships.
Clicking on the ▶ icon will expand the view and display that issue’s parent-child relationships.
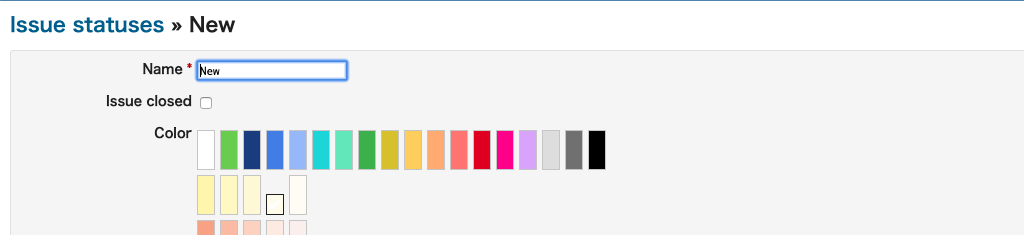
❏ Setting Display Colors for Issue Statuses
Setting Status Display Color
You can assign different colors for different issue statuses.
Supplementary Information
Display colors can be set by users with administrative permissions in Redmine.
From the Redmine administration menu, clicking “Issue statuses” will take you to the editing screen, where you can select the color for each status.
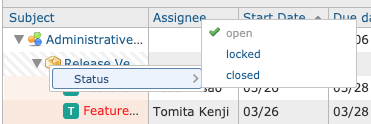
❏ Changing Version Status
Right-clicking the version in the left pane will display a context menu which allows you to change the status information.
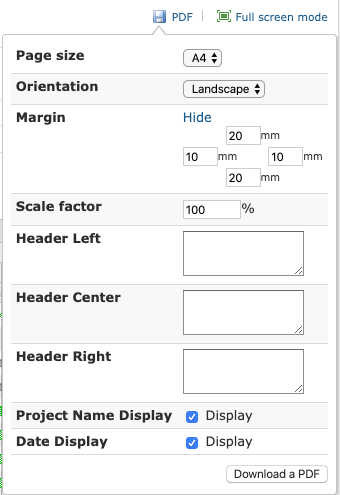
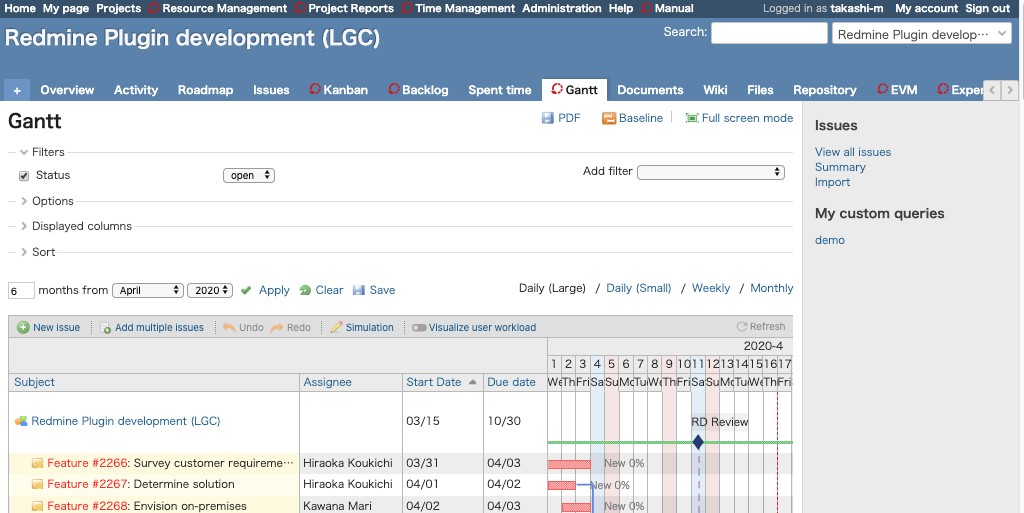
❏ Downloading PDFs
Clicking the PDF link and selecting the size and orientation will allow you to download the Gantt chart as a PDF.
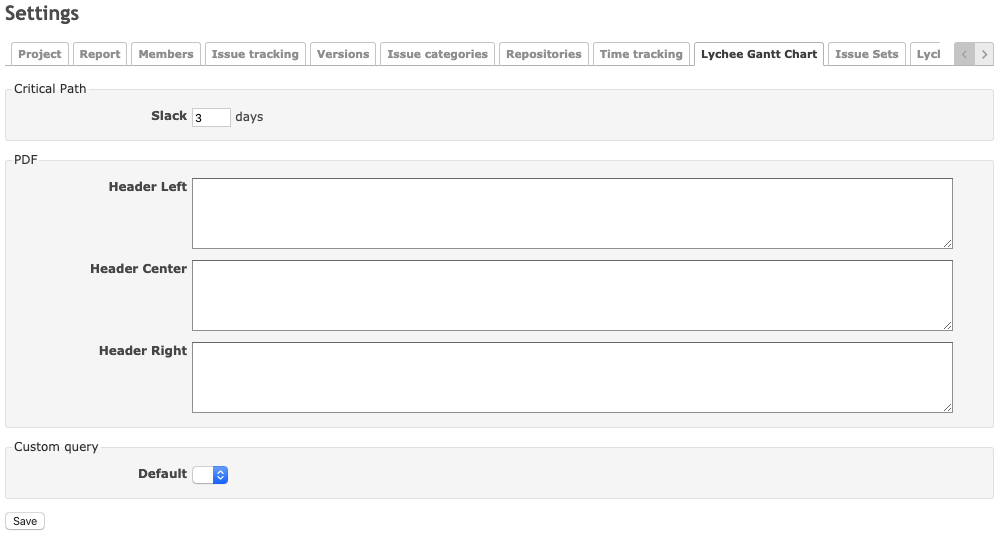
❏ Setting Headers
In the Project Settings > Lychee Gantt Chart tab, you can set the information you want to output in PDF headers beforehand.
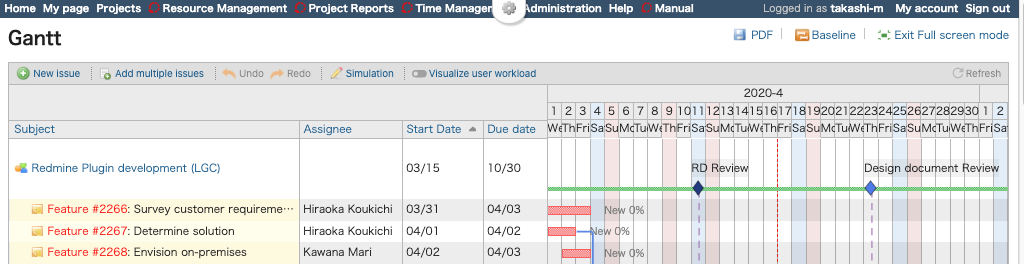
❏ Full screen Mode
Clicking the “Full screen Mode” link will display the Gantt chart in fullscreen mode.
To return to the normal view, click on the “Exit Full screen mode” button.
Normal view
Full screen mode
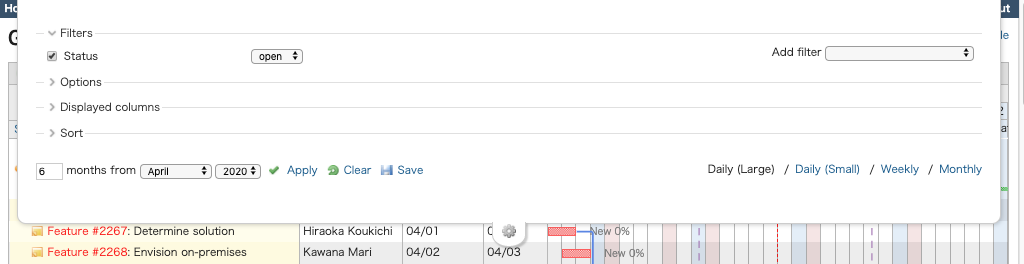
Clicking on the cog icon at the top of the screen in fullscreen mode will display settings such as “Filters”.
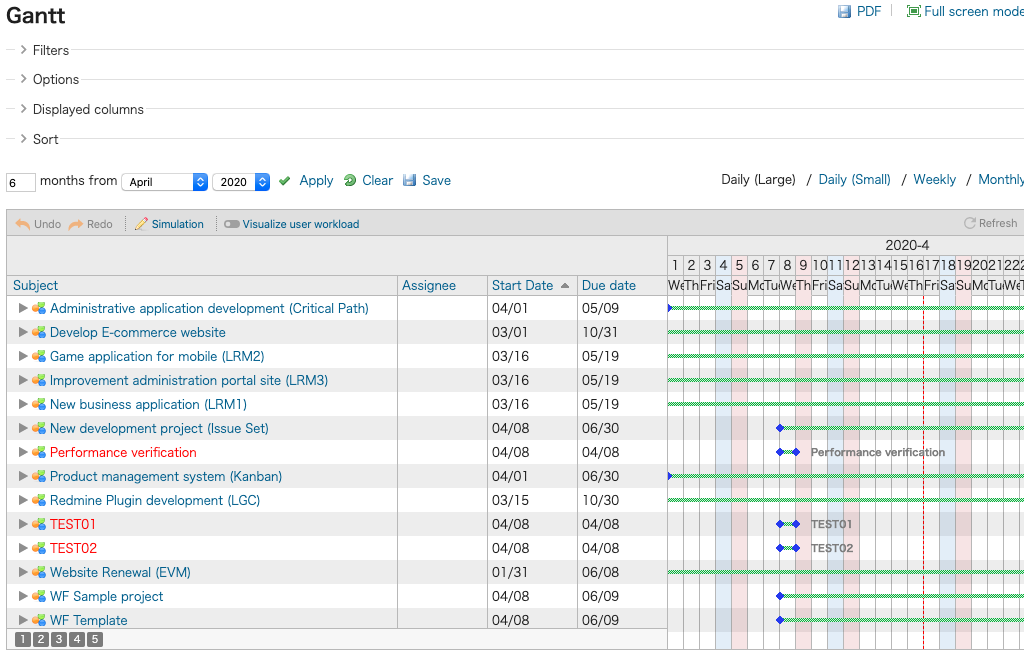
❏ Expanding and Shrinking
You can expand and shrink the Gantt chart by clicking on the Daily (Large), Daily (Small), Weekly, and Monthly links at the top right of the chart.
At zoom level 2 or higher, dates will be displayed in the header section.
Zoom level 1 (Displayed unit of time: month) 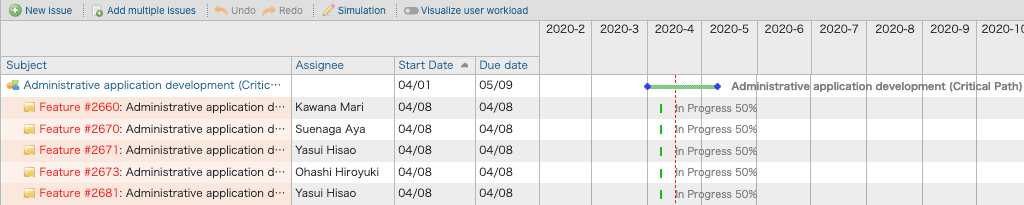
Zoom level 2 (Displayed unit of time: week) 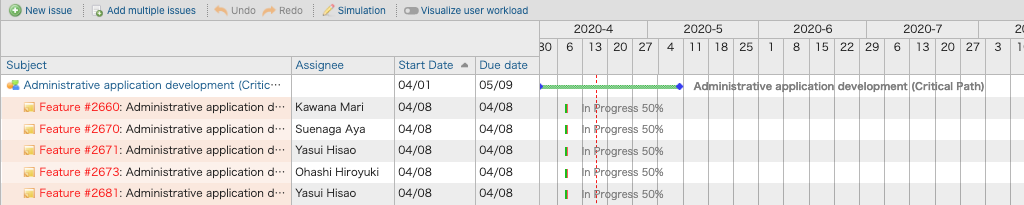
Zoom level 3 (Displayed unit of time: week, detailed version) 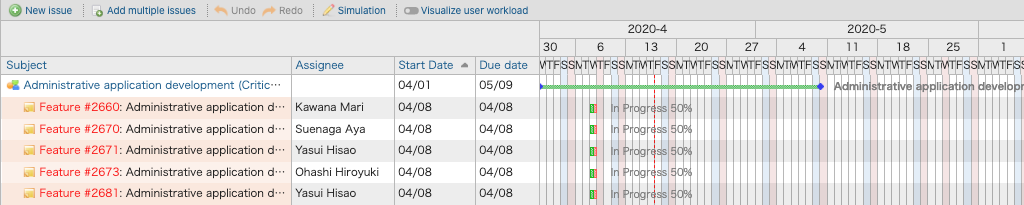
Zoom level 4 (Displayed unit of time: day) 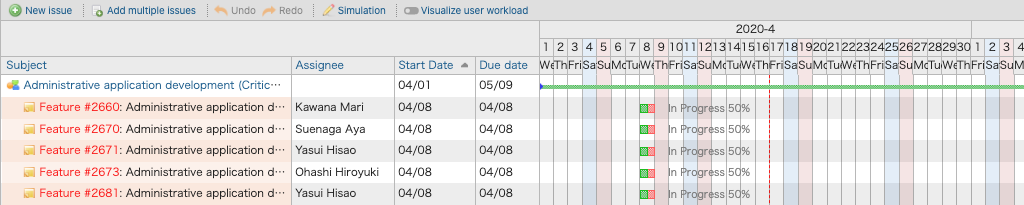
❏ Changing Displayed columns
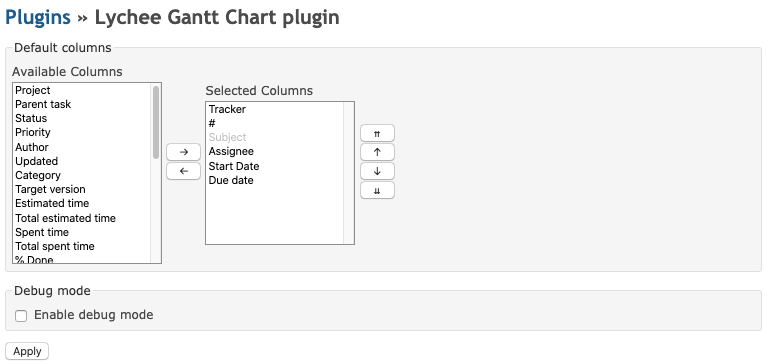
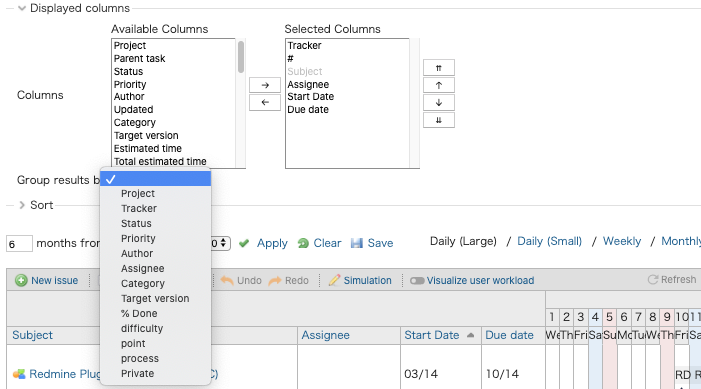
You can customize the columns displayed in the rows of information at the left of a Gantt chart. Under “Options” on the Gantt chart screen, clicking the “▶” next to “Displayed columns” will allow you to select the columns to be displayed.
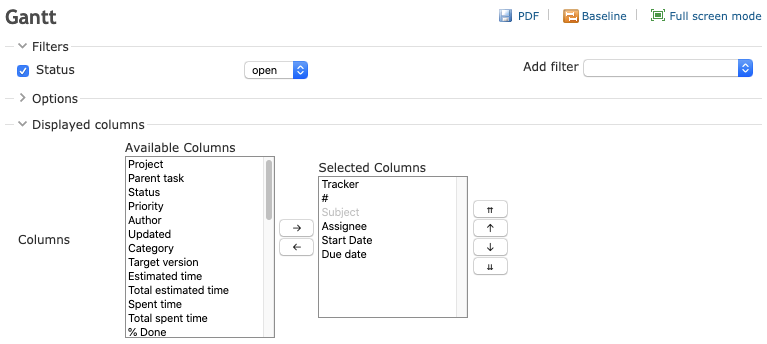
Available Columns: These items will not be displayed in the Gantt chart.
Selected Columns: These items will be displayed in the Gantt chart.
Clicking an item you want to be displayed in “Available Columns” and then clicking the right arrow “→ ” will move the item to “Selected Columns”.
Clicking an Column you do not want to be displayed in “Selected Columns” and then clicking the left arrow “← ” will move the item to ” Available Columns”.
After selecting the items you want to be displayed, click “Apply, and the columns from “Selected Columns” will be displayed in the Gantt chart.
Note: “Subject” is a required item and cannot be edited.
Default Display Columns Settings
You can edit the items displayed by default in a Gantt chart by going to Administration > Plugins > Lychee Gantt Chart > Configure.
❏ Sorting
You can perform a sort on a Gantt chart by specifying up to 3 sort conditions.
Clicking on the “▶” next to “Sort” in a Gantt chart will allow you to select the items to be sorted.
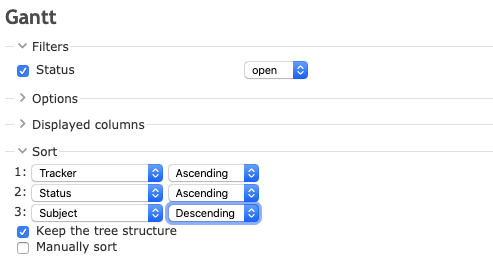
Checking the “Keep the tree structure” box will perform the sort while preserving parent-child relationships. Additionally, when you preserve tree structures during a sort, the sort is performed on issues at each level separately.
For example, in the following case:
Parent Issue A
  |
  |
  | Child Issue A
  |     |
  |     | Grandchild Issue A
  |     |
  |     | Grandchild Issue B
  |
  |  Child Issue B
  |     |
  |     | Grandchild Issue C
  |     |
  |     | Grandchild Issue D
  |
  |Child Issue C

Parent Issue B
- Parent Issues A and B are sorted
- Child Issues A, B, and C are sorted
- Grandchild Issues A and B are sorted, Grandchild Issues C and D are sorted
will be the result.
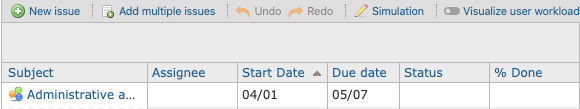
You can also click the names of items in the Gantt chart’s header section to add them to the sort conditions.
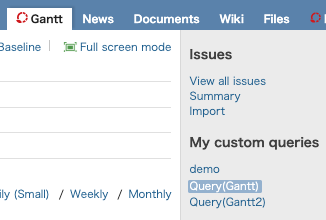
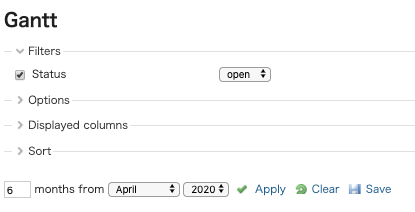
❏ Saving Queries
You can save queries on the Issue List tab and on the Gantt chart separately.
Creating a Query
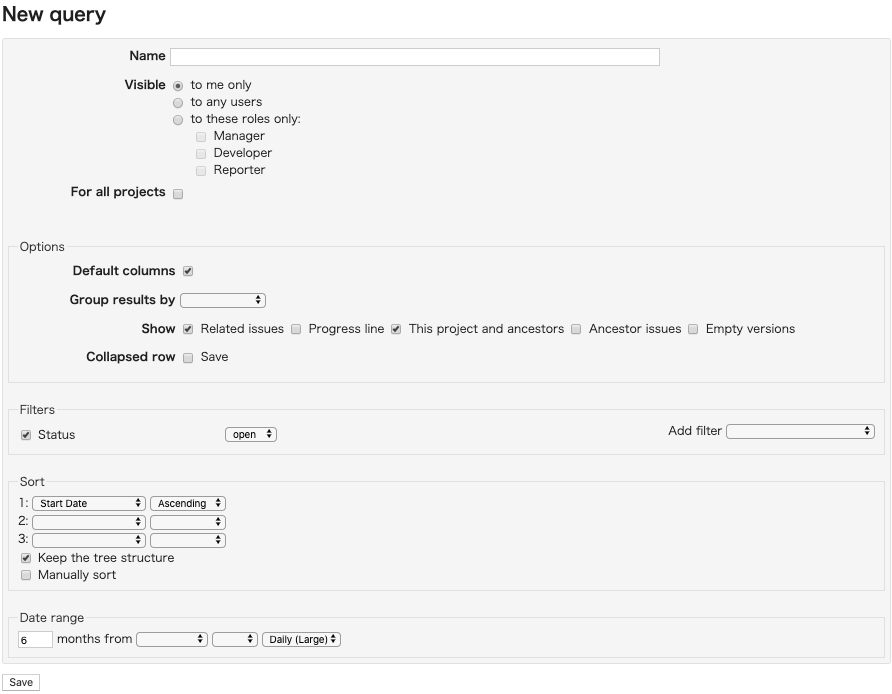
To create a query, click the “Save” anchor.
Once you are taken to the query input screen, input the necessary information and click the “Save” button.
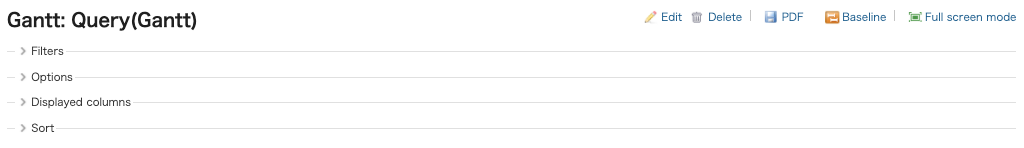
Editing/Deleting a Query
When applying a created query, you can edit or delete it using the “Edit” and “Delete” anchors at the top right of the Gantt chart screen.
Setting Custom Queries Applied by Default
You can set custom queries to be applied by default by going to a project’s Settings > Lychee Gantt Chart > Custom query.
❏ Editing an Issue by Double-clicking
You can directly edit the data displayed in each row by double-clicking on a column.
❏ Manual Sorting
Checking the “Manually sort” box under Sort Conditions and clicking “Apply” will switch to a mode where you can manually order issues, versions, and projects.
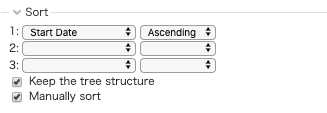
In manually sort mode, a “⇕” icon will be displayed to the left of each subject. You can change the order of entries by dragging-and-dropping these icons.
Manually sort can only be used on issues, versions, or projects of the same level. After sorting, the new display order will be saved for that user only.
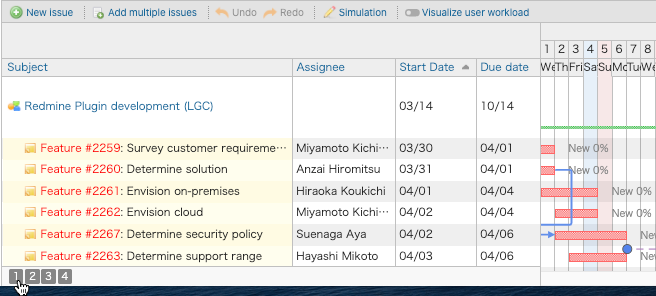
❏ Opening and Closing Entire Levels
Clicking on the number icons at the bottom of the screen will open or close all issues on the level corresponding to that number.
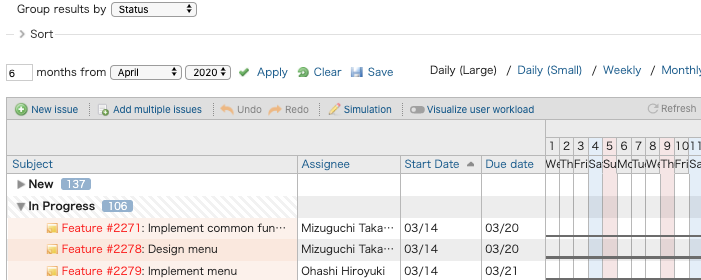
❏ Group Conditions
Selecting and applying a “Group results by,” which is displayed below “Displayed columns”, allows you to display a list based on the Group Condition you selected.
However, while the Group Condition is in effect, you cannot use the Manually sort function.
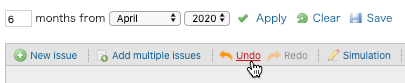
❏ Undo Function
You can reverse operations you have carried out since opening a Gantt chart.
a. Undo
You can use Undo to reverse operations you have carried out. You can Undo as many times as you have performed an operation since opening the Gantt chart.
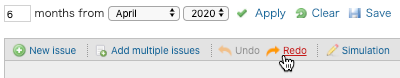
b. Redo
You can use Redo to reapply any operations on which you have used Undo. You can Redo as many times as you have used the Undo function.
Notes about Undo:
- Even if several users are performing operations, you can only Undo the operations which you have done.
- If you change several columns at once, Undo will apply to all of them at the same time.
- If another user has updated the same item you performed an operation on, you can no longer use Undo.
- You cannot use Undo on a deleted issue.
❏ Issue Adding Mode
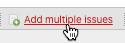
This mode operates like spreadsheet software, allowing you to continually add issues and easily create a WBS. Click the “Add multiple issues” link to enter Issue Adding Mode.
Clicking the link will display the tracker selection screen which is used when creating issues.
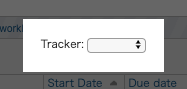
You can select any tracker which is being used by a project open in Lychee Gantt Chart. When creating an issue for a sub-project, if the selected tracker cannot be used by the sub-project, the tracker being used by the sub-project will be used instead.
If you mouse over the space between data rows in Issue Adding Mode, an empty row will be added. Clicking on it will display a subject input field.
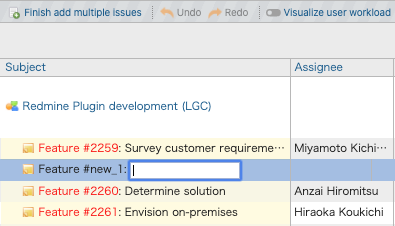
Inputting a subject and pressing the Enter key will create an issue in the empty row. If there are required fields, a tool tip will appear when you press the Enter key. You can continue to create issues until you exit Issue Adding Mode. To exit Issue Adding Mode, click the “Finish add multiple issues” link.
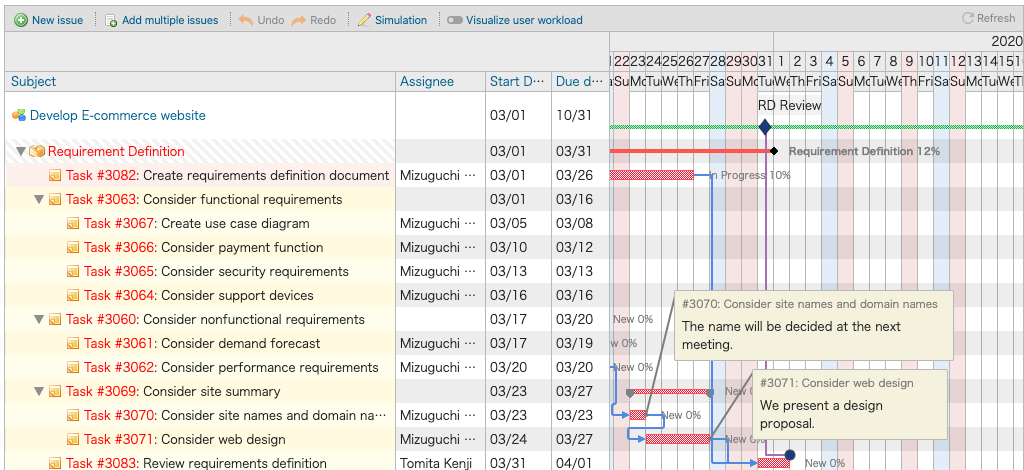
❏ Displaying Notes on Issues
Checking the “Annotations” box under Options will cause the most recent note added to an issue to be displayed on the Gantt chart screen.
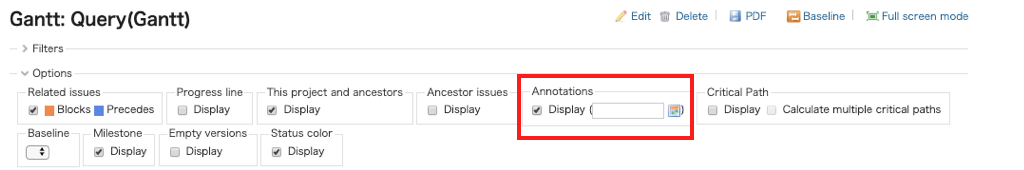
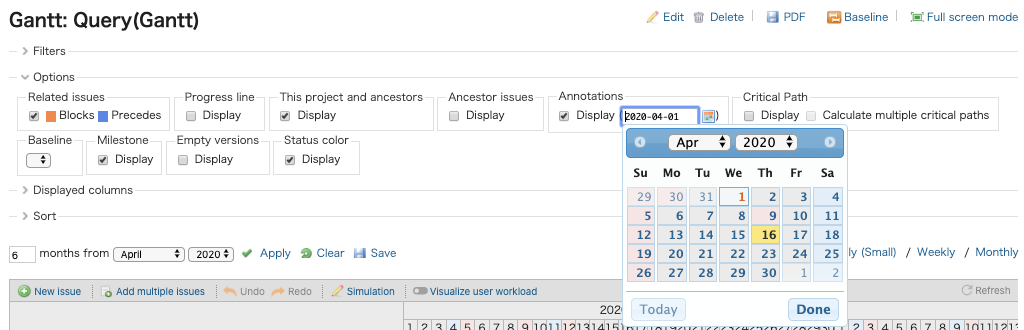
You can specify the note’s creation date using the calendar icon. The most recent note entered after the specified date will be displayed.
❏ Displaying Higher-level Issues
Checking the “Ancestor issues” under Options will cause the parent issue to be displayed for any child issues to which the filter applies.
❏ Critical Paths
You can display critical paths on Gantt charts. In the Gantt chart’s “Options”, check the box in the Critical Path section marked “Display”.
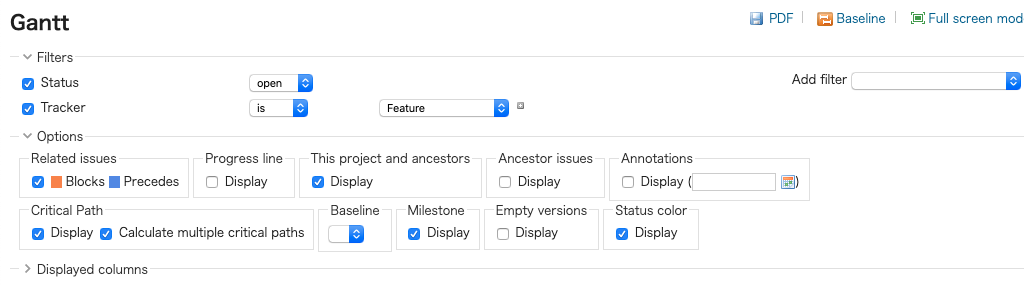
To display multiple critical paths, check the box marked “Calculate multiple critical paths”.
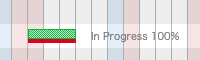
Critical Path Display
A red bar appears under the Gantt bar being displayed.
Critical Path Grouping
Issues meeting the following criterion are considered a single group:
- A chain of sequentially linked issues
Determining a Critical Path
- If “Version” is not selected in the filter, the critical path is the issue with the latest “Due Date” of all issues in the relevant project.
- If “Version” is selected in the filter, the critical path is the issue within the relevant project with the latest “Due Date” linked to each selected version.
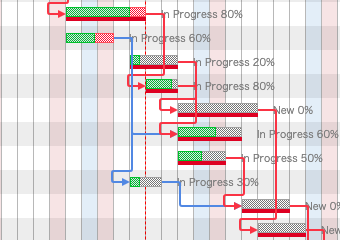
- If multiple critical paths are being displayed, the critical path for each group is the issue with the latest “Due Date”.
Issues without any sequential ordering cannot have multiple critical paths displayed.
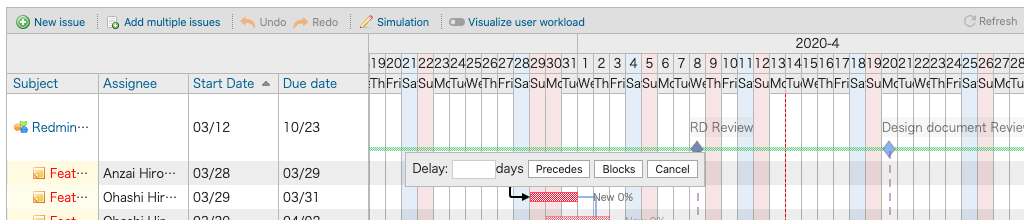
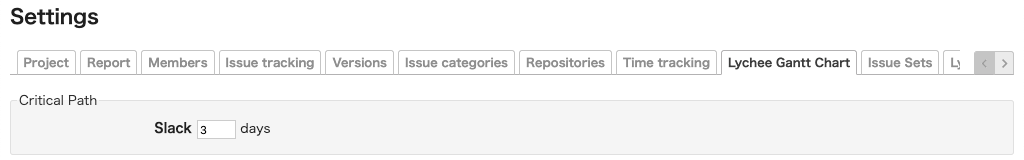
Setting a Buffer Period
A buffer period(slack) is the number of days used to determine whether or not a preceding issue is included in the critical path. Buffer periods can be set on a project’s Settings > Lychee Gantt Chart tab.
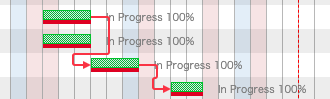
An issue preceding a “Critical Path Issue” which fulfills
[Delay Period] (Interval from preceding issue) ≦ [Buffer Period(=Slack)]
will become part of the critical path. Additionally, issues which are both included in the critical path are connected by a red line.
- ❏ Setting Permissions
- ❏ Changing Dates (Period)
- ❏ Changing Dates (Start Date)
- ❏ Setting Dates
- ❏ Solid Lines Displayed in Gantt Charts
- ❏ Creating a New Issue
- ❏ Editing an Issue
- ❏ Changing Sequence of Issues
- ❏ Changing Parent-Child Relationships between Issues
- ❏ Collapsing/Expanding Parent-child Issues
- ❏ Setting Display Colors for Issue Statuses
- ❏ Changing Version Status
- ❏ Downloading PDFs
- ❏ Setting Headers
- ❏ Full screen Mode
- ❏ Expanding and Shrinking
- ❏ Changing Displayed columns
- ❏ Sorting
- ❏ Saving Queries
- ❏ Editing an Issue by Double-clicking
- ❏ Manual Sorting
- ❏ Opening and Closing Entire Levels
- ❏ Group Conditions
- ❏ Undo Function
- ❏ Issue Adding Mode
- ❏ Displaying Notes on Issues
- ❏ Displaying Higher-level Issues
- ❏ Critical Paths
- Baseline Functions
- ❏ Saving a Baseline
- ❏ Applying a Baseline
- ❏ Displaying Progress Lines for Baselines
- Milestone Functions
- ❏ What is a Milestone?
- ❏ Adding a Milestone
- ❏ Displaying Versions with No Linked Issues
- Simulation Mode Function
- ❏ What is Simulation Mode?
- ❏ Operating Simulation Mode
- Visualize user workload Function
- ❏ What is Visualize user workload?
- ❏ Operating Visualize user workload
Baseline Functions
❏ Saving a Baseline
You can save a Baseline as a standard by clicking on “Baseline” at the top right of the screen.
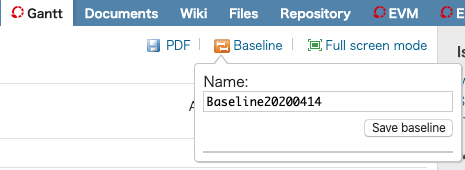
The baseline is saved based on the start and due dates of each issue at the time of saving.
❏ Applying a Baseline
You can display a saved baseline by going to “Baseline” under Options.
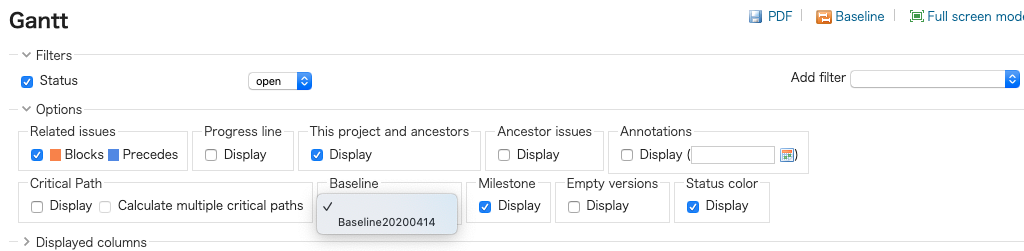
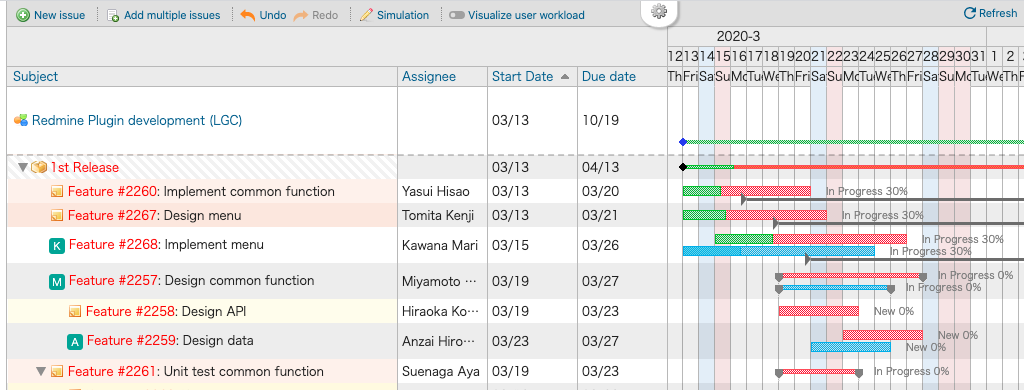
Select the baseline to be displayed and click “Apply”.
The selected baseline will be displayed as a blue bar under each issue.※The baseline will not be displayed if its start date and length are the same as the issue’s.
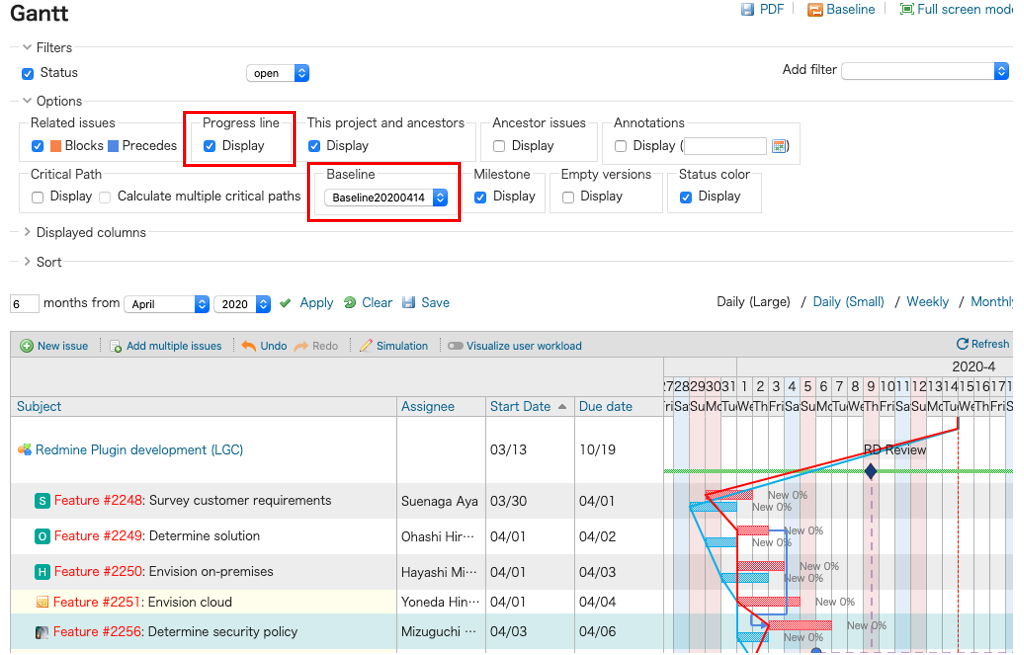
❏ Displaying Progress Lines for Baselines
If you set both “Display Baseline” and “Display Progress Line” as ON in the Options section, the progress line will be displayed for the baseline, too.
Milestone Functions
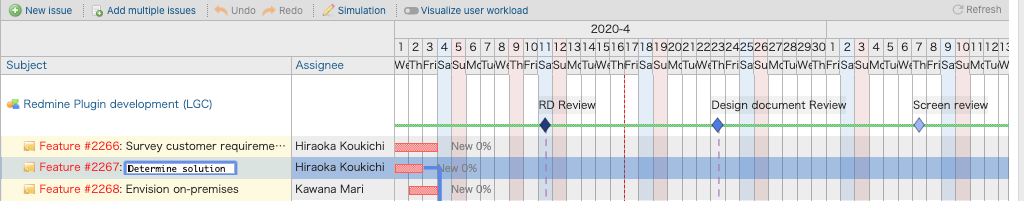
❏ What is a Milestone?
Milestones are major points during the process of a project which you can set to help you manage progress.
・Signs for Critical Points
Adding signs to mark planned “Critical Points”, “Intermediate Goals”, and “Final Deadlines” can help keep track of how far the project has progressed.
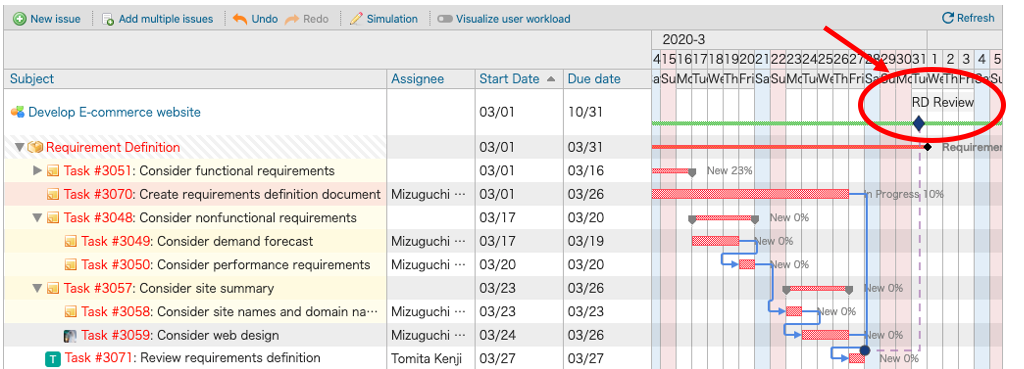
・Checking Progress
You can link Milestones and Issues to check at a glance whether a project is progressing according to plan or behind schedule.
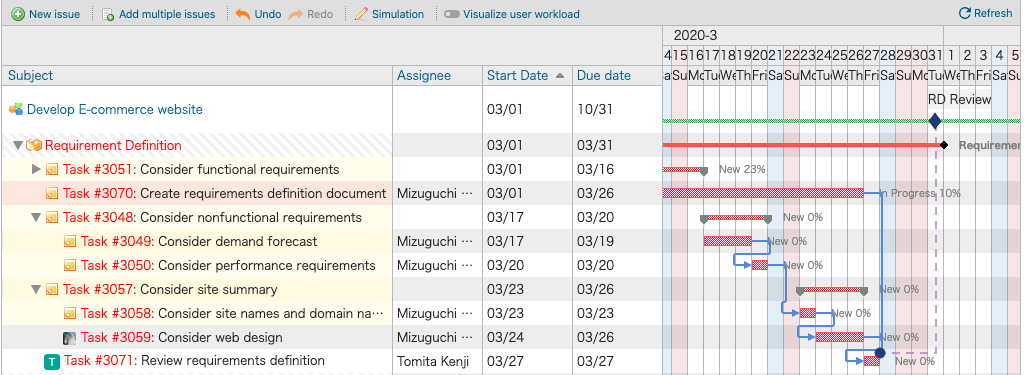
a. If progress is as planned, the Milestone is displayed as a dashed line.
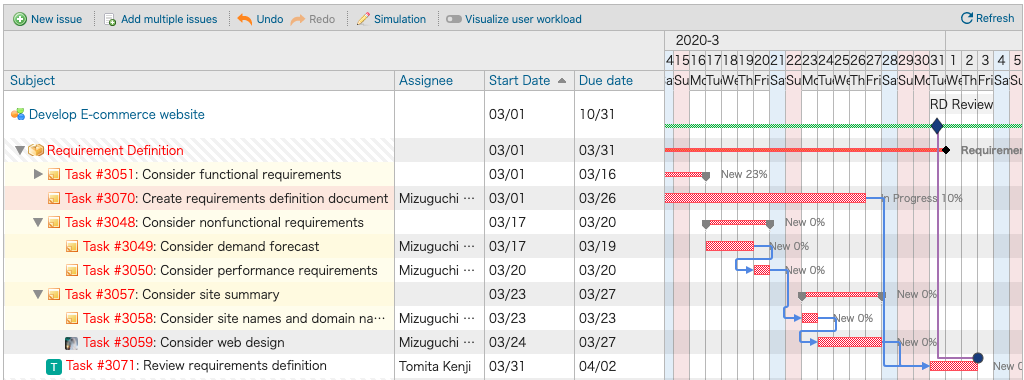
b. If progress is behind schedule, the Milestone is displayed as a solid line.
❏ Adding a Milestone
・Getting Started
You must first set permissions before you can use Milestones. You can set the “View Milestones” and “Manage milestones” permissions from Administration > Roles and permissions.

・Displaying Milestones in Gantt Charts
You can change display settings under Options on the Lychee Gant Chart screen. Checking the “Display” checkbox under the “Milestone” option will display a Milestone input field below the row with the days of the week.
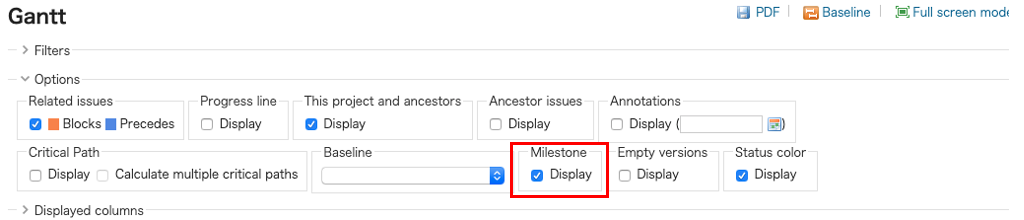
※You can only add Milestones in the “Daily” zoom mode
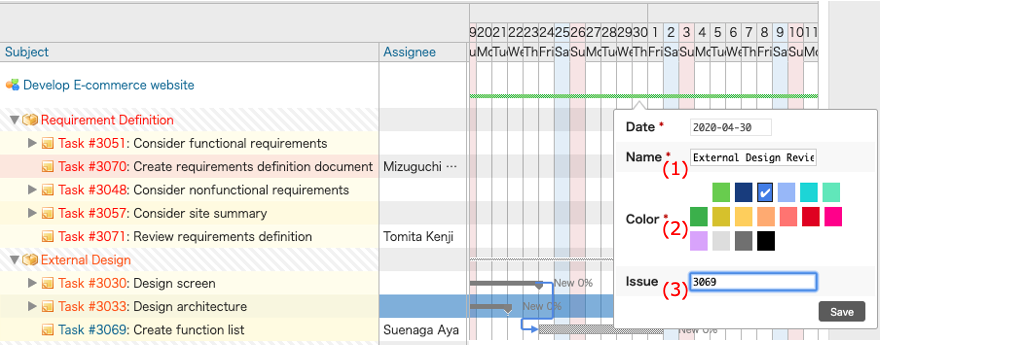
・Adding a Planned Critical Point
You can add signs to mark planned “Critical Points”, “Intermediate Goals”, and “Final Deadlines”, which can help keep track of how the project is progressing.
(1). Click the position want to set the milestone, tooltip for adding the milestone will be displayed.
(2). Enter the Milestone’s name and select its display color.
(3). Enter the issue to be linked with the Milestone and click “Save”.
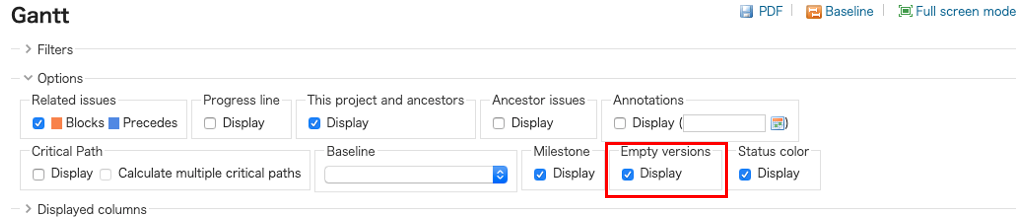
❏ Displaying Versions with No Linked Issues
You can choose whether or not to display versions with no linked issues.
Checking the “Display” box under “Empty versions” in the Options section will caused versions without linked issues to be displayed.
By default, such versions are not displayed.
Simulation Mode Function
❏ What is Simulation Mode?
Simulation Mode is a useful function for checking how an entire project plan will change if modifications are made to elements such as task order.
Normally, when an issue’s information is changed it is immediately reflected in the system. In Simulation Mode, however, you can change issue information without it being reflected in the system and without notifications being sent to project members until you press the “Save” button. This allows you to edit data without worry.
Clicking “Simulation” at the top of a Gantt chart will take you into Simulation Mode.
Note:
Operations which do not affect issue information, such as “Filters”, “Options”, “Displayed columns “, or “Sort”, are not affected by Simulation Mode.
❏ Operating Simulation Mode
Clicking “Simulation” at the top of a Gantt chart will take you into Simulation Mode. You can also output PDFs while in Simulation Mode.

While in Simulation Mode, the background becomes diagonally striped.

Any changes you make to issues while in Simulation Mode can be applied to the Gantt chart by clicking “Save”.
If you do not want to apply the changes, click “Cancel” to restore the chart’s original state.
You can also output PDFs while in Simulation Mode.
Visualize user workload Function
❏ What is Visualize user workload?
You can now display the total estimated times per user on a Gantt chart.
You can manage a schedule by quickly checking and adjusting each user’s estimated times on a daily basis.
Note:
To use the Visualize user workload function, you must install “Lychee Resource Management”.
❏ Operating Visualize user workload
Clicking “Visualize user workload” at the top of a Gantt chart will display the estimated times for each user.
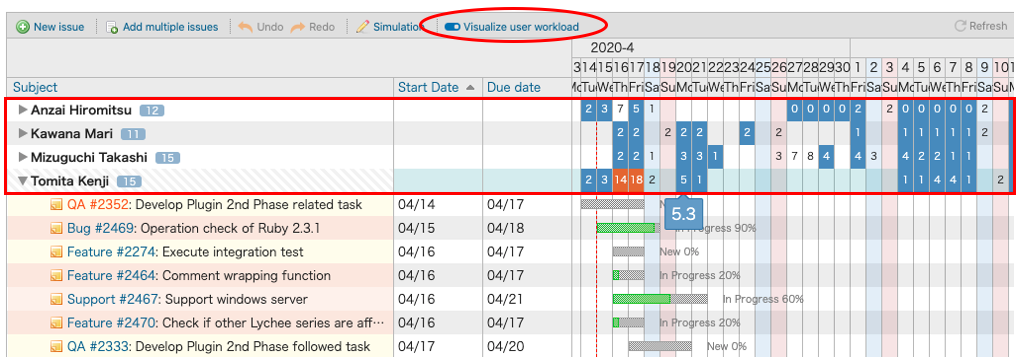
Times are displayed with units of 1 hour.
Fractions are rounded to the nearest whole number.
- 5.4 (5 hours 24 minutes) -> 5
- 5.5 (5 hours 30 minutes) -> 6
Mousing over a given number will display the exact amount of time.
Changing the start or due date for an issue will immediately update the estimated times for each user.
コメント